Finding memory leaks with Valgrind and Top
January 2023 (1738 Words, 10 Minutes)
In this post, I’m going to cover my go-to workflow for tracking down memory
leaks in C++. If your program’s memory usage is climbing and it shouldn’t be,
two tools will get you to the answer fast: Top tells you if you’re leaking,
and Valgrind tells you where.
Every new or malloc in C++ needs a matching delete/delete[] or free.
Miss one and memory silently accumulates — your program works fine until it
doesn’t. These are my notes to myself for the next time I need to debug one.
Table of Contents
- Spotting the Problem with Top
- Pinpointing the Leak with Valgrind
- Common Leak Patterns
- Caveats and Tips
Spotting the Problem with Top
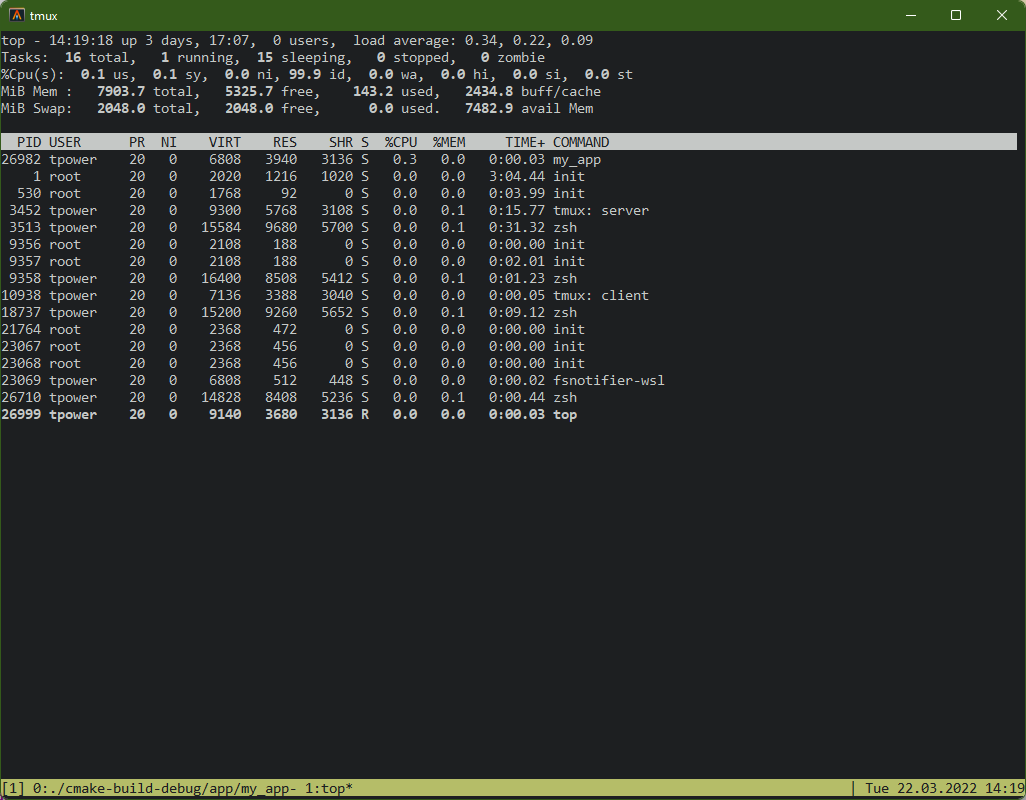
Top shows running Linux processes and their resource usage. By itself it’s
noisy — processes jump around and it’s hard to keep track of the one you want:
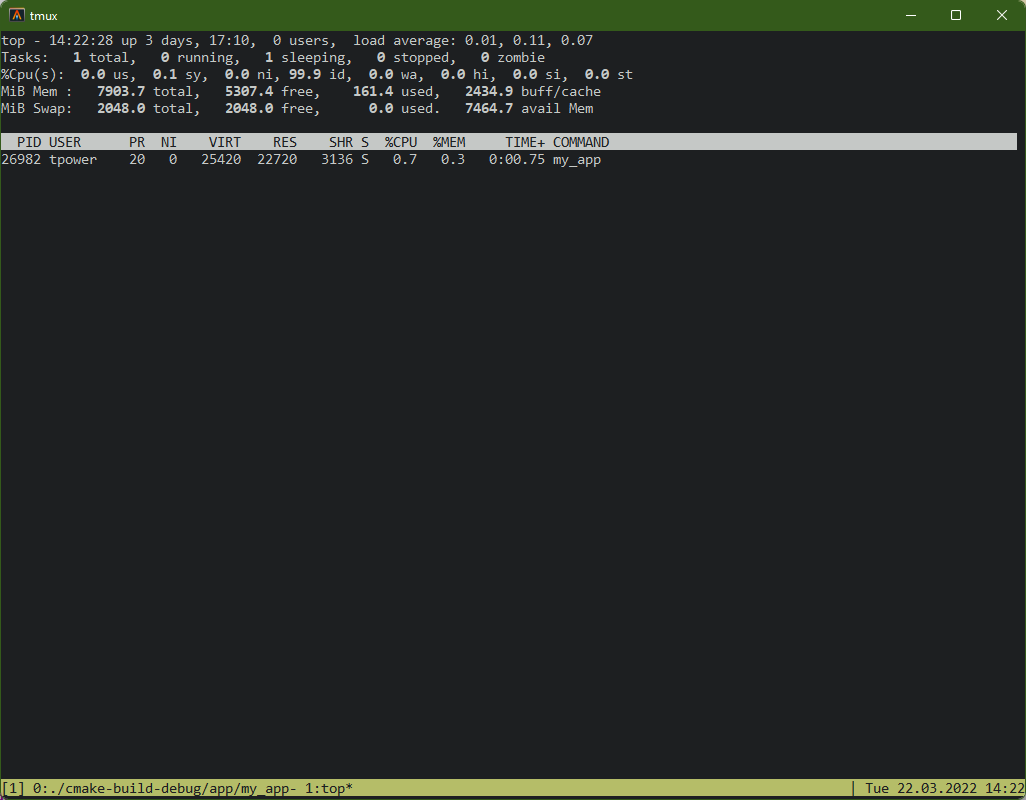
We can use the -p switch and pass Top the PID to watch just our process:
Finding the PID each time is repetitive, so we can extract it from the process list automatically:
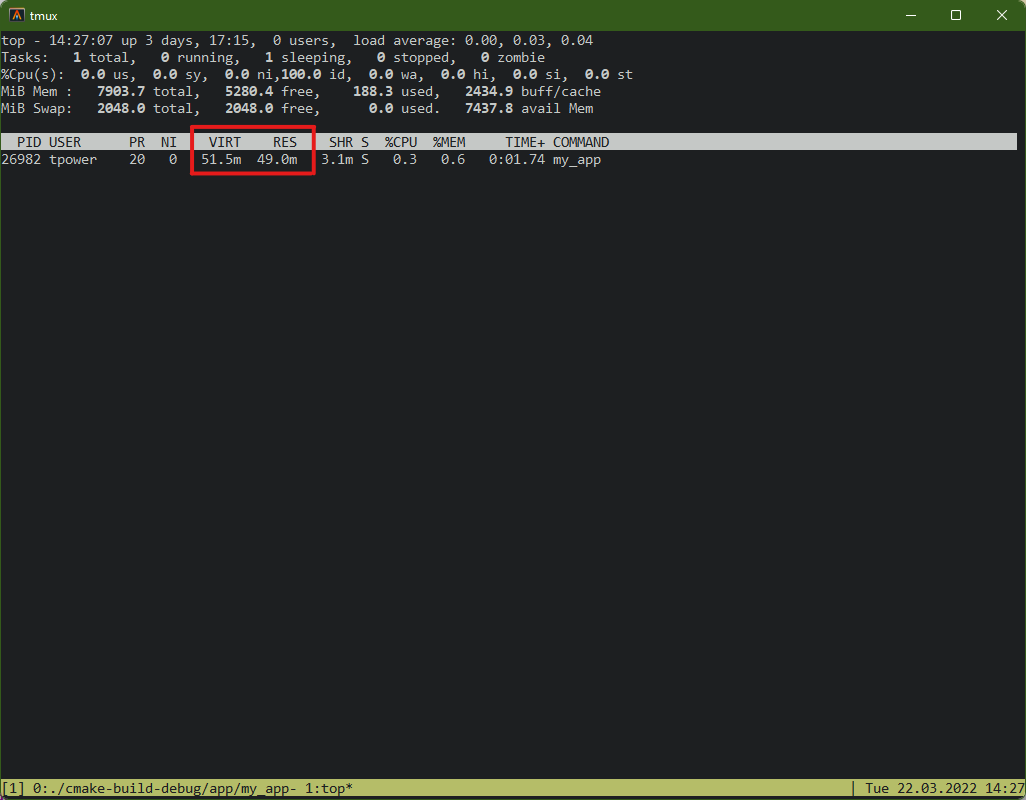
top -p $(ps -aux | grep mem_leak | head -n 1 | awk '{print $2}')Now press E to cycle the memory display units (KB, MB, GB). Watch the RES
column — if it’s growing over time, you have a leak.
Top confirms a leak exists, but it can’t tell you where in the code it is.
That’s where Valgrind comes in.
Pinpointing the Leak with Valgrind
Valgrind instruments your binary at runtime to track every allocation and
deallocation. Its default tool, memcheck, reports what was allocated but never
freed.
There are two levels of detail. Running valgrind on its own gives you a
summary — how many bytes leaked:
valgrind ./mem_leak missing_delete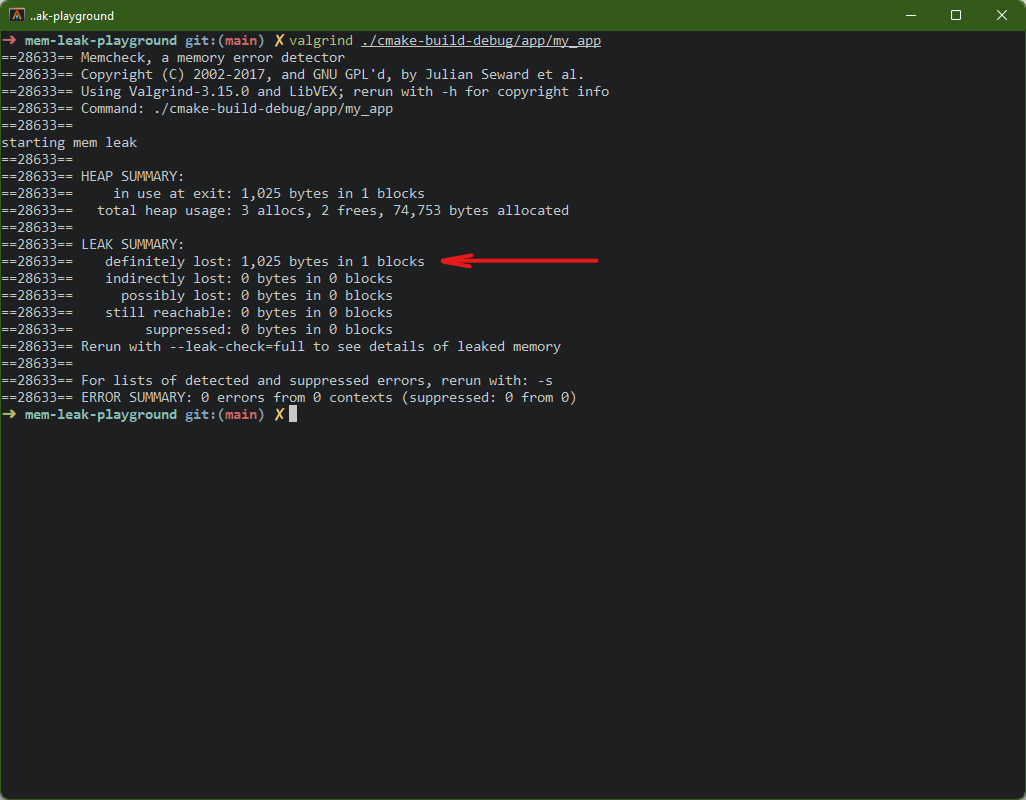
Running with --leak-check=full reveals the exact file and line where the
leaked memory was allocated, plus the stack trace:
valgrind --leak-check=full ./mem_leak missing_delete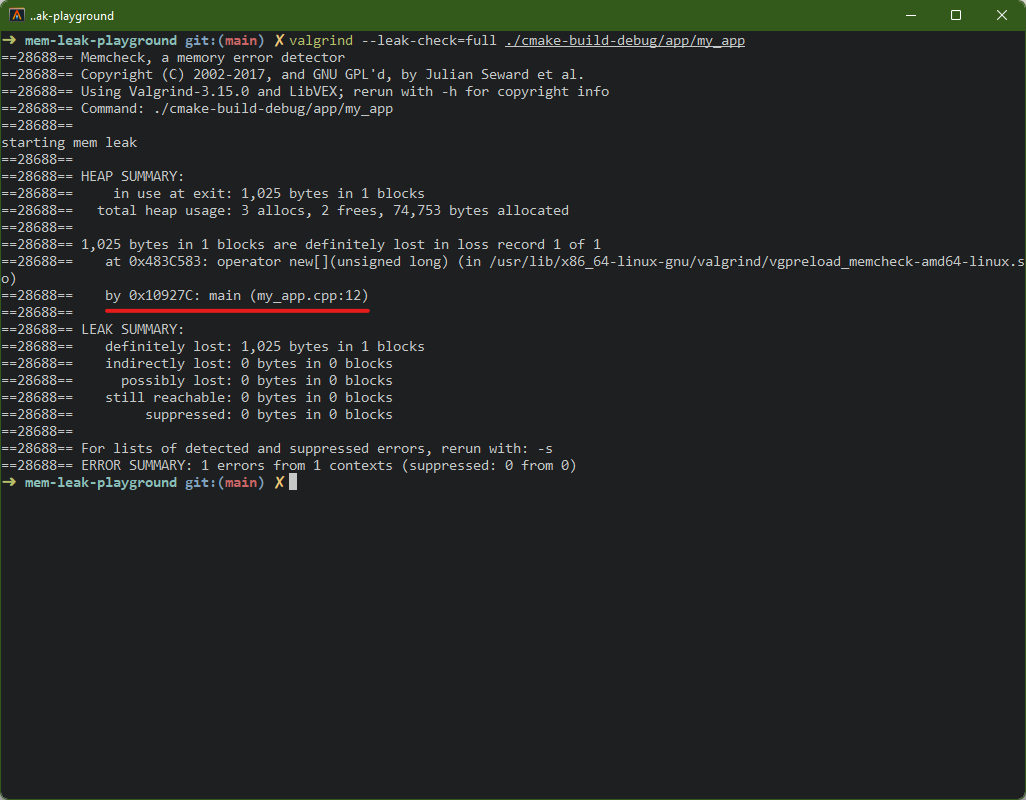
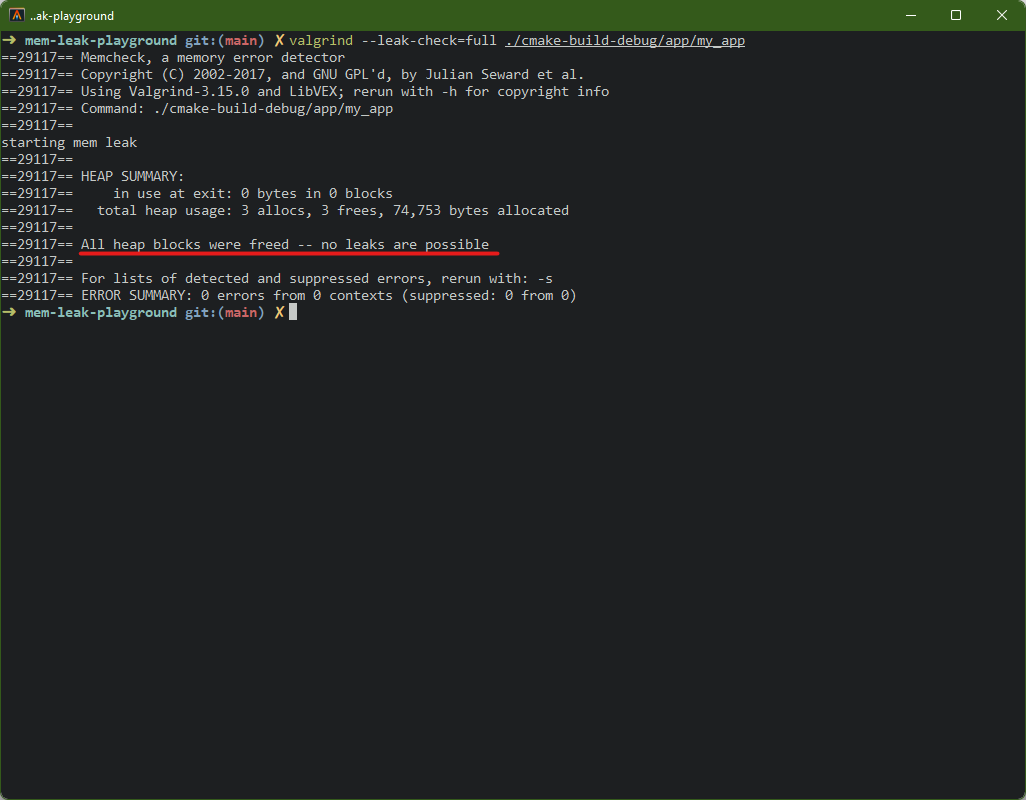
After fixing the leak, running Valgrind again displays the happy news:
Reading the Output
The key sections to look at:
==12345== HEAP SUMMARY:
==12345==   in use at exit: 1,025 bytes in 1 blocks
==12345==   total heap usage: 2 allocs, 1 frees, ...
in use at exit: memory that was allocated but never freed before the program endedtotal heap usage: ifallocs>frees, something wasn’t cleaned updefinitely lost: Valgrind is certain this memory is unreachable. This is a real leakindirectly lost: lost because a pointer to it was itself lost (e.g. a struct that held a pointer)possibly lost: Valgrind isn’t sure. Might be a leak, might be an unusual pointer patternstill reachable: technically not freed, but a pointer to it still exists at exit (often not a real problem, e.g. global singletons)
The stack trace under definitely lost is the gold — it shows the exact
function and line that allocated the leaked memory.
Common Leak Patterns
Once Valgrind points you to a line, you still need to understand why it
leaked. These are the patterns that come up over and over.
Missing delete — The Obvious One
The simplest case. You new something and never free it:
// Leak
int main() {
    bool* arr = new bool[1025];
    // ... use arr ...
    return EXIT_SUCCESS;  // arr leaked — no delete[]
}
// Fix — just add the matching delete
int main() {
bool* arr = new bool[1025];
// ... use arr ...
delete[] arr;
return EXIT_SUCCESS;
}Prevention: Prefer std::unique_ptr or std::make_unique — the destructor
handles cleanup automatically:
auto arr = std::make_unique<bool[]>(1025);
// ... use arr.get() ...
// unique_ptr frees on scope exit
Lost Pointers — Reassignment Without Freeing
You overwrite a pointer with a new allocation, and the old one becomes unreachable:
// Leak — original 256 bytes are orphaned
char* buffer = new char[256];
buffer = new char[512];   // old pointer is gone
delete[] buffer;           // only frees the 512 allocation
// Fix — free before reassigning
char* buffer = new char[256];
delete[] buffer;
buffer = new char[512];
// ...
delete[] buffer;Prevention: Reassigning a unique_ptr automatically frees the previous
value:
auto buffer = std::make_unique<char[]>(256);
// old allocation freed automatically
buffer = std::make_unique<char[]>(512);
Early Return in Error Paths
The allocation and the delete are both there, but an early return skips the
cleanup. This one is sneaky because the happy path looks correct:
// Leak — if fopen fails, buffer is never freed
bool processFile(const std::string& filename) {
    char* buffer = new char[4096];
    FILE* file = fopen(filename.c_str(), "r");

    if (!file) {
        return false;  // buffer leaked!
    }

    // ... process file ...
    delete[] buffer;
    fclose(file);
    return true;
}
// Fix — RAII ensures cleanup regardless of return path
bool processFile(const std::string& filename) {
auto buffer = std::make_unique<char[]>(4096);
FILE* file = fopen(filename.c_str(), "r");
if (!file) {
return false; // unique_ptr cleans up automatically
}
// ... process file ...
fclose(file);
return true;
}Prevention: This is the strongest argument for RAII and smart pointers — they handle every exit path, not just the one you remembered.
Containers of Raw Pointers
std::vector::clear() destroys the pointers, not what they point to. The
objects are leaked:
// Leak — clear() removes the pointers but doesn't delete the objects
std::vector<Widget*> widgets;
widgets.push_back(new Widget());
widgets.push_back(new Widget());
widgets.push_back(new Widget());
widgets.clear();  // 3 Widgets leaked
// Fix — manually delete before clearing
for (auto* w : widgets) {
delete w;
}
widgets.clear();Prevention: Use std::vector<std::unique_ptr<Widget>> — the smart pointers
free the objects when the vector is cleared or goes out of scope:
std::vector<std::unique_ptr<Widget>> widgets;
widgets.push_back(std::make_unique<Widget>());
widgets.push_back(std::make_unique<Widget>());
widgets.clear();  // all Widgets freed automatically
Circular References with shared_ptr
Smart pointers don’t eliminate leaks entirely. If two shared_ptrs point at
each other, neither reference count ever reaches zero:
// Leak — A and B keep each other alive forever
struct Node {
    std::shared_ptr<Node> next;
};

auto a = std::make_shared<Node>();
auto b = std::make_shared<Node>();
a->next = b;
b->next = a;  // circular reference — neither is ever freed
// Fix — break the cycle with weak_ptr
struct Node {
std::weak_ptr<Node> next; // doesn't contribute to reference count
};Prevention: Use std::weak_ptr for back-references or any relationship
that shouldn’t keep the object alive.
Valgrind catches all of these. The pattern doesn’t change — run
valgrind --leak-check=full, read the stack trace, find the allocation, figure
out which category it falls into, and apply the fix.
Caveats and Tips
- Compile with
-g:Valgrindneeds debug symbols to show file names and line numbers in stack traces. Without-g, you get hex addresses instead. - Valgrind is slow: it instruments every memory access, so programs run 10-50x slower. Use small inputs when profiling.
- Linux-first:
Valgrindworks best on Linux. macOS support is limited and lags behind. On macOS, consider running in a Docker container or Linux VM. - Suppression files: third-party libraries (OpenGL drivers, system libs) sometimes have “leaks” that aren’t your fault.
Valgrindsuppression files let you ignore these so you can focus on your own code. - Alternative — AddressSanitizer: compile with
-fsanitize=address(Clang/GCC) for a lighter-weight option that’s faster thanValgrindbut catches fewer issues. Good for CI.
Valgrind.